Financial Review
Consolidated financial condition
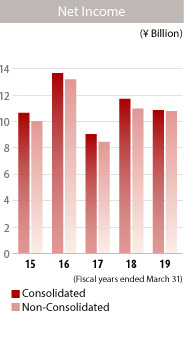
Income
Total income decreased ¥4,779 million (5.3%) year on year to ¥85,847 million, primarily because of a decrease in other ordinary income as a result of a decrease in gain on sales of bonds and a decrease in other income, due to a decrease in gain on sales of equity securities. On the other hand, total expenses decreased ¥3,464 million (4.7%) year on year to ¥70,542 million, primarily because of a decrease in other ordinary expenses as a result of a decrease in loss on sales of bonds.
Net income attributable to owners of the parent decreased ¥846 million (7.2%) year on year to ¥10,843 million.
| Millions of yen | ||||
|---|---|---|---|---|
| 2019 | 2018 | Increase (decrease) |
||
| Interest income | ¥54,044 | ¥53,153 | ¥891 | |
| Average interest-earning assets | 5,213,562 | 5,098,700 | 114,862 | |
| Average interest rate of interest-earning assets (%) | 1.03 | 1.04 | (0.01) | points |
| Interest expense | 4,656 | 5,044 | (388) | |
| Average interest-bearing liabilities | 5,613,981 | 5,110,159 | 503,822 | |
| Average interest rate of interest-bearing liabilities (%) | 0.08 | 0.09 | (0.01) | points |
| Net interest income | 49,388 | 48,108 | 1,279 | |
| Funding cost (%) | 0.81 | 0.90 | (0.09) | points |
| Net interest margin (%) | 0.22 | 0.14 | 0.08 | points |
| Note: | Figures for average interest-bearing liabilities are presented after deducting the average outstanding balance of money held in trust and interests. |
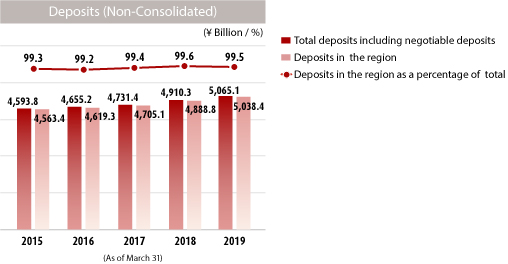
Deposits and negotiable certificates of deposit
Deposits and negotiable certificates of deposit as of March 31, 2019 increased ¥155,177 million (3.2%) from a year earlier to ¥5,052,774 million, due primarily to the solid performance of individual deposits and corporate deposits.
| Millions of yen | ||||
|---|---|---|---|---|
| 2019 | 2018 | Increase (decrease) |
||
| Individuals | ¥3,741,707 | ¥3,647,772 | ¥93,934 | |
| Corporations | 1,047,888 | 1,000,645 | 47,243 | |
| Governments | 240,048 | 230,017 | 10,031 | |
| Financial institutions | 35,456 | 31,961 | 3,494 | |
| Total | ¥5,065,101 | ¥4,910,396 | ¥154,705 | |
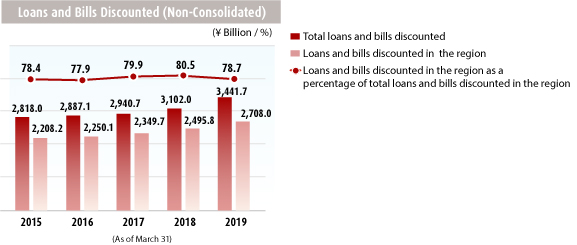
Loans and bills discounted
Loans and bills discounted as of March 31, 2019 increased ¥336,125 million (10.9%) from a year earlier to ¥3,431,337 million, due primarily to increases in loans to corporate customers as well as loans to individuals such as housing loans.
| Millions of yen | |||||||
|---|---|---|---|---|---|---|---|
| 2019 | 2018 | 2017 | 2016 | 2015 | 2019/2018 Increase (decrease) |
||
| Balance of loans to individuals | ¥1,188,146 | ¥1,014,861 | ¥909,265 | ¥845,213 | ¥788,485 | ¥173,285 | |
| Balance of loans to individuals in the region | 1,188,101 | 1,014,815 | 909,219 | 845,206 | 788,477 | 173,285 | |
| Loans to individuals as a percentage of total loans | 34.5% | 32.7% | 30.9% | 29.3% | 28.0% | 1.8 | points |
| Loans to individuals in the region as a percentage of total loans in the region | 43.9 | 40.7 | 38.7 | 37.6 | 35.7 | 3.2 | |
| Millions of yen | ||||||
|---|---|---|---|---|---|---|
| 2019 | 2018 | 2017 | 2016 | 2015 | 2019/2018 Increase (decrease) |
|
| Consumer loans | ¥1,172,255 | ¥997,845 | ¥891,264 | ¥826,295 | ¥768,703 | ¥174,410 |
| Housing loans | 1,125,634 | 952,761 | 848,167 | 784,465 | 727,908 | 172,873 |
| Securities and other | 46,620 | 45,084 | 43,097 | 41,829 | 40,795 | 1,536 |
| Millions of yen | |||||||
|---|---|---|---|---|---|---|---|
| 2019 | 2018 | 2017 | 2016 | 2015 | 2019/2018 Increase (decrease) |
||
| Balance of loans to small and medium-sized enterprises | ¥1,260,720 | ¥1,174,650 | ¥1,117,723 | ¥1,068,951 | ¥997,513 | ¥86,069 | |
| Balance of loans to small and medium-sized enterprises in the region | 1,052,432 | 1,008,053 | 966,258 | 923,768 | 893,459 | 44,378 | |
| Loans to small and medium-sized enterprises as a percentage of total loans | 36.6% | 37.9% | 38.0% | 37.0% | 35.4% | -1.3 | points |
| Loans to small and medium-sized enterprises in the region as a percentage of total loans in the region | 38.9 | 40.4 | 41.1 | 41.1 | 40.5 | -1.5 | |
| Notes: | 1. | The above amounts do not include loans from Japan offshore market accounts. |
| 2. | Small and medium-sized enterprises are classified as those having capital of ¥300 million or less (¥100 million or less in the wholesale industry; ¥50 million or less in the retail and service industries) or those having 300 or fewer employees (100 or fewer in the wholesale industry; 50 or fewer in the retail industry and 100 or fewer in the service industry). |
| Millions of yen | ||
|---|---|---|
| 2019 | 2018 | |
| ¥3,441,753 | ¥3,102,047 | |
| Manufacturing | 362,702 | 334,900 |
| Agriculture, Forestry | 7,160 | 6,452 |
| Fishery | 3,485 | 3,448 |
| Mining, Quarrying, Gravel quarrying | 13,504 | 11,055 |
| Construction | 105,742 | 103,472 |
| Utilities | 90,026 | 76,121 |
| Telecommunication | 12,374 | 10,612 |
| Transport, Post | 123,174 | 117,092 |
| Wholesale & Retail | 267,809 | 250,875 |
| Finance & Insurance | 344,023 | 256,023 |
| Real estate, Rental | 461,927 | 437,798 |
| Academic research, Specialist and Technical service | 13,680 | 13,768 |
| Accomodation | 13,747 | 13,414 |
| Food | 17,780 | 16,046 |
| Lifestyle-related service, Entertainment | 24,547 | 24,278 |
| Education, Learning support | 7,640 | 7,444 |
| Medical, Social welfare | 121,611 | 119,620 |
| Other services | 39,908 | 40,713 |
| National and local government | 222,758 | 244,045 |
| Other | 1,188,146 | 1,014,861 |
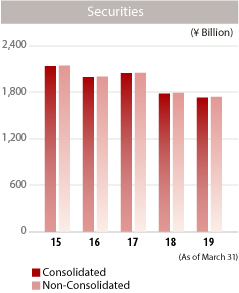
Securities
The balance of securities as of March 31, 2019 decreased ¥47,318 million (2.7%) from a year earlier to ¥1,731,418 million.
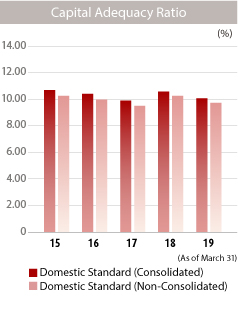
Capital adequacy ratio
Hyakugo Bank applies domestic standards for determining capital adequacy.
As of March 31, 2019, the Bank’s capital adequacy ratio, on a consolidated basis, based on domestic standards was 10.09 percent. On a non-consolidated basis, the capital adequacy ratio based on domestic standards was 9.74 percent.
| Millions of yen | ||||
|---|---|---|---|---|
| Consolidated | Non-Consolidated | Consolidated | Non-Consolidated | |
| March 31 | 2019 | 2019 | 2018 | 2018 |
| Capital adequacy ratio (%) | 10.09 | 9.74 | 10.60 | 10.27 |
| Amount of total capital | ¥239,444 | ¥228,552 | ¥234,886 | ¥224,418 |
| Amount of total risk-adjusted assets | 2,371,102 | 2,345,878 | 2,215,554 | 2,183,948 |
| Amount of minimum total capital | 94,844 | 93,835 | 88,622 | 87,357 |
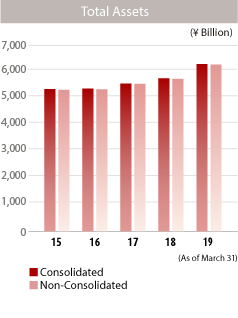
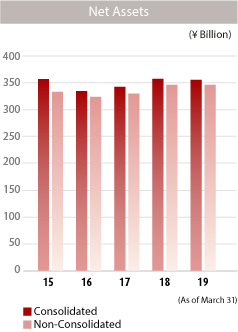
Net assets
Net assets as of March 31, 2019 totaled ¥355,859 million.
Cash flows
Cash flow from operating activities increased ¥262,437 million, due primarily to an increase in deposits. Cash flow from investing activities increased ¥33,436 million, due primarily to proceeds from sales of securities. Cash flow from financing activities decreased ¥2,158 million, due primarily to the payment of dividends.