
Financial Review
Consolidated financial condition
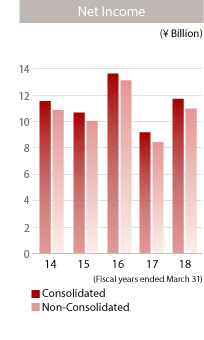
Income
Total income increased ¥8,042 million (9.6%) year on year to ¥91,437 million, primarily because of an increase in total interest income as a result of an aggressive effort to increase loans and bills discounted and an increase in gain on sales of bonds. On the other hand, total expenses increased ¥4,579 million (6.5%) year on year to ¥74,818 million, primarily because of an increase in other ordinary expenses as a result of an increase in loss on sales of bonds.
Net income attributable to owners of the parent increased ¥2,649 million (29.3%) year on year to ¥11,690 million.
| Millions of yen | ||||
|---|---|---|---|---|
| 2018 | 2017 | Increase (decrease) |
||
| Interest income | ¥53,153 | ¥51,139 | ¥2,013 | |
| Average interest-earning assets | 5,098,700 | 5,070,811 | 27,889 | |
| Average interest rate of interest-earning assets (%) | 1.04 | 1.00 | 0.04 | points |
| Interest expense | 5,044 | 4,576 | 468 | |
| Average interest-bearing liabilities | 5,110,159 | 5,001,236 | 108,922 | |
| Average interest rate of interest-bearing liabilities (%) | 0.09 | 0.09 | - | points |
| Net interest income | 48,108 | 46,563 | 1,544 | |
| Funding cost (%) | 0.90 | 0.92 | (0.02) | points |
| Net interest margin (%) | 0.14 | 0.08 | 0.06 | points |
| Note: | Figures for average interest-bearing liabilities are presented after deducting the average outstanding balance of money held in trust and interests. |
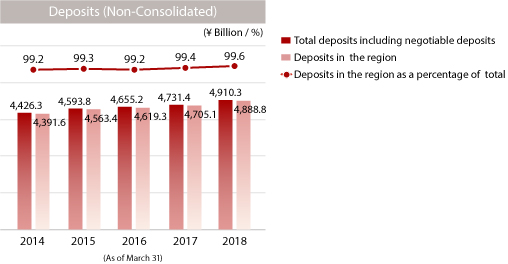
Deposits and negotiable certificates of deposit
Deposits and negotiable certificates of deposit as of March 31, 2018 increased ¥178,492 million (3.8%) from a year earlier to ¥4,897,596 million, due primarily to the solid performance of individual deposits and corporate deposits.
| Millions of yen | ||||
|---|---|---|---|---|
| 2018 | 2017 | Increase (decrease) |
||
| Individuals | ¥3,647,772 | ¥3,551,239 | ¥96,532 | |
| Corporations | 1,000,645 | 946,519 | 54,125 | |
| Governments | 230,017 | 197,632 | 32,384 | |
| Financial institutions | 31,961 | 36,054 | (4,092) | |
| Total | ¥4,910,396 | ¥4,731,445 | ¥178,950 | |
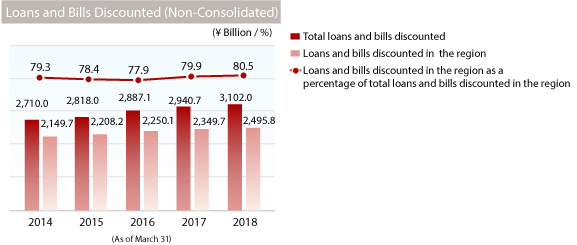
Loans and bills discounted
Loans and bills discounted as of March 31, 2018 increased ¥159,344 million (5.4%) from a year earlier to ¥3,095,211 million, due primarily to increases in loans to individuals such as housing loans as well as loans to small and medium-sized enterprises.
| Millions of yen | |||||||
|---|---|---|---|---|---|---|---|
| 2018 | 2017 | 2016 | 2015 | 2014 | 2018/2017 Increase (decrease) |
||
| Balance of loans to individuals | ¥1,014,861 | ¥909,265 | ¥845,213 | ¥788,485 | ¥718,749 | ¥105,595 | |
| Balance of loans to individuals in the region | 1,014,815 | 909,219 | 845,206 | 788,477 | 718,738 | 105,597 | |
| Loans to individuals as a percentage of total loans | 32.7% | 30.9% | 29.3% | 28.0% | 26.5% | 1.8 | points |
| Loans to individuals in the region as a percentage of total loans in the region | 40.7 | 38.7 | 37.6 | 35.7 | 33.4 | 2.0 | |
| Millions of yen | ||||||
|---|---|---|---|---|---|---|
| 2018 | 2017 | 2016 | 2015 | 2014 | 2018/2017 Increase (decrease) |
|
| Consumer loans | ¥997,845 | ¥891,264 | ¥826,295 | ¥768,703 | ¥697,856 | ¥106,580 |
| Housing loans | 952,761 | 848,167 | 784,465 | 727,908 | 656,251 | 104,593 |
| Securities and other | 45,084 | 43,097 | 41,829 | 40,795 | 41,605 | 1,987 |
| Millions of yen | |||||||
|---|---|---|---|---|---|---|---|
| 2018 | 2017 | 2016 | 2015 | 2014 | 2018/2017 Increase (decrease) |
||
| Balance of loans to small and medium-sized enterprises | ¥1,174,650 | ¥1,117,723 | ¥1,068,951 | ¥997,513 | ¥915,739 | ¥56,927 | |
| Balance of loans to small and medium-sized enterprises in the region | 1,008,053 | 966,258 | 923,768 | 893,459 | 865,490 | 41,794 | |
| Loans to small and medium-sized enterprises as a percentage of total loans | 37.9% | 38.0% | 37.0% | 35.4% | 33.8% | -0.1 | points |
| Loans to small and medium-sized enterprises in the region as a percentage of total loans in the region | 40.4 | 41.1 | 41.1 | 40.5 | 40.3 | -0.7 | |
| Notes: | 1. | The above amounts do not include loans from Japan offshore market accounts. |
| 2. | Small and medium-sized enterprises are classified as those having capital of ¥300 million or less (¥100 million or less in the wholesale industry; ¥50 million or less in the retail and service industries) or those having 300 or fewer employees (100 or fewer in the wholesale industry; 50 or fewer in the retail industry and 100 or fewer in the service industry). |
| Millions of yen | ||
|---|---|---|
| 2018 | 2017 | |
| ¥3,102,047 | ¥2,940,712 | |
| Manufacturing | 334,900 | 345,516 |
| Agriculture, Forestry | 6,452 | 6,298 |
| Fishery | 3,448 | 4,117 |
| Mining, Quarrying, Gravel quarrying | 11,055 | 10,313 |
| Construction | 103,472 | 102,648 |
| Utilities | 76,121 | 70,010 |
| Telecommunication | 10,612 | 17,418 |
| Transport, Post | 117,092 | 100,482 |
| Wholesale & Retail | 250,875 | 256,453 |
| Finance & Insurance | 256,023 | 273,802 |
| Real estate, Rental | 437,798 | 388,066 |
| Academic research, Specialist and Technical service | 13,768 | 12,909 |
| Accomodation | 13,414 | 14,119 |
| Food | 16,046 | 15,387 |
| Lifestyle-related service, Entertainment | 24,278 | 22,866 |
| Education, Learning support | 7,444 | 7,264 |
| Medical, Social welfare | 119,620 | 112,832 |
| Other services | 40,713 | 38,824 |
| National and local government | 244,045 | 232,112 |
| Other | 1,014,861 | 909,265 |
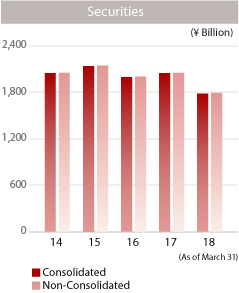
Securities
The balance of securities as of March 31, 2018 decreased ¥264,830 million (13.0%) from a year earlier to ¥1,778,737 million.
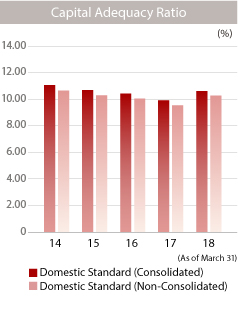
Capital adequacy ratio
Hyakugo Bank applies domestic standards for determining capital adequacy. Starting from September 30, 2017, the Bank changed the method of measuring the amounts of credit risks and assets from the Basic Indicator Approach (BIA) to the Foundation Internal Rating-Based (FIRB) approach. As of March 31, 2018, the Bank’s capital adequacy ratio based on domestic standards was 10.60 percent. On a non-consolidated basis, the capital adequacy ratio based on domestic standards was 10.27 percent.
| Millions of yen | ||||
|---|---|---|---|---|
| Consolidated | Non-Consolidated | Consolidated | Non-Consolidated | |
| March 31 | 2018 | 2018 | 2017 | 2017 |
| Capital adequacy ratio (%) | 10.60 | 10.27 | 9.91 | 9.52 |
| Amount of total capital | ¥234,886 | ¥224,418 | ¥245,206 | ¥232,969 |
| Amount of total risk-adjusted assets | 2,215,554 | 2,183,948 | 2,472,420 | 2,445,131 |
| Amount of minimum total capital | 88,622 | 87,357 | 98,896 | 97,805 |
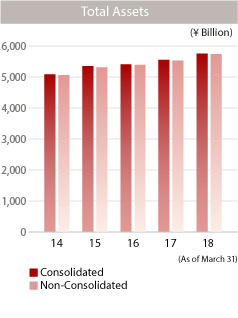
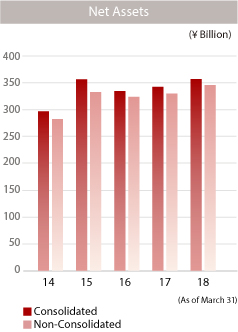
Net assets
Net assets as of March 31, 2018 totaled ¥357,391 million.
Cash flows
Cash flow from operating activities increased ¥12,895 million, due primarily to an increase in deposits. Cash flow from investing activities increased ¥274,220 million, due primarily to proceeds from sales of securities. Cash flow from financing activities decreased ¥6,337 million, due primarily to payments for purchase of stocks in subsidiaries not resulting in ownership interests in subsidiaries that do not result in change in scope of consolidation. As a result, cash and cash equivalents at the end of the fiscal year increased ¥280,772 million to ¥608,857 million.